


Imagine driving past that unassuming industrial site on your way home, never suspecting the invisible cloud it’s sending your way. These super-polluters lurk in plain sight across America, pumping out toxins that drift far beyond their fences. Property owners miles away feel the hit without even knowing why.
Here’s the kicker: one facility can tank home values in a 50-mile radius through sneaky fine particles. Let’s uncover how this happens right under our noses. Ready to see what’s blowing in the wind?
Super-Polluters: A Handful Do Most Damage

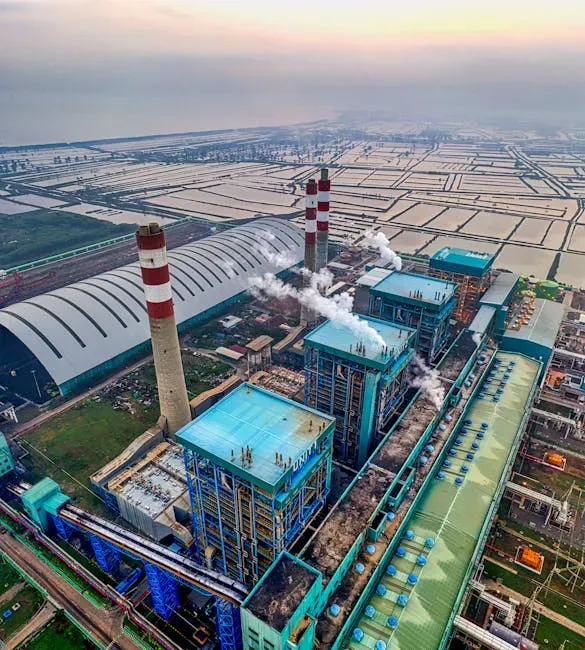
The U.S. Environmental Protection Agency’s Toxics Release Inventory reveals that just a small number of facilities churn out the lion’s share of toxic emissions each year. Thousands of plants report billions of pounds released annually, yet certain ones dominate their regions. These super-emitters grab headlines for good reason; they overload local air with chemicals that linger.
Take the EPA’s latest data from 2023 and 2024. Facilities like metal mines and chemical plants top the lists with hundreds of millions of pounds managed as waste. It’s not spread evenly; a few bad apples spoil the atmospheric barrel for everyone nearby.
Pollution Plumes Stretch Far and Wide
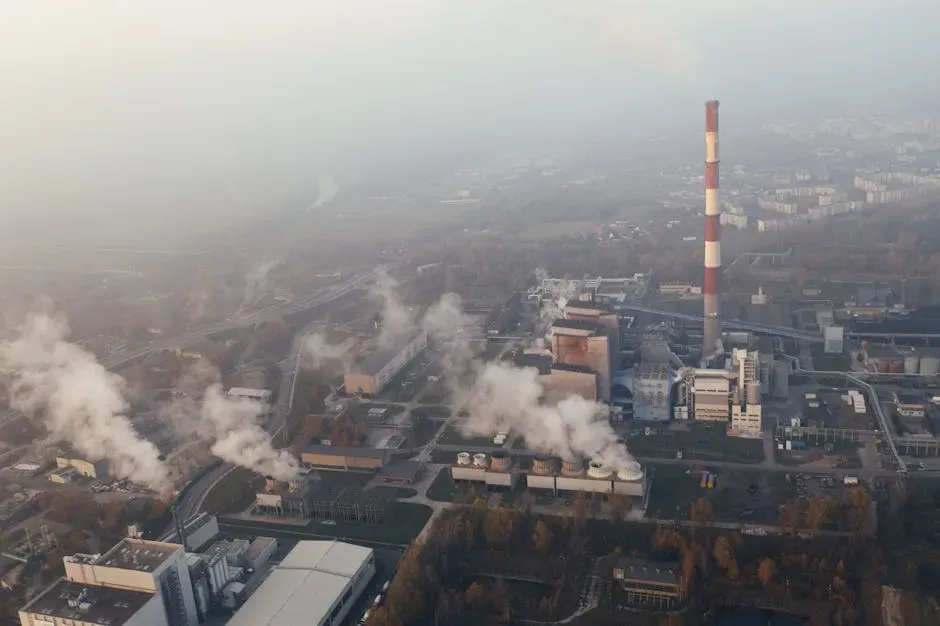
Fine particulate matter, or PM2.5, from these factories doesn’t stay put. A 2024 analysis shows it can waft tens of miles, even up to 50 or more, carried by winds across counties. Studies confirm these particles hang in the air for days, blanketing distant neighborhoods.
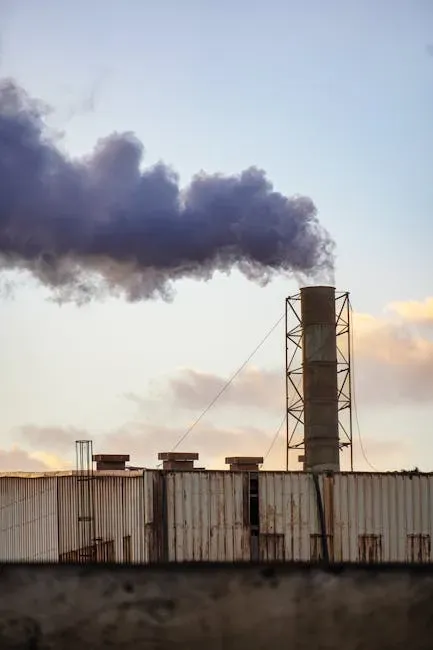
Picture a single stack belching smog that settles 40 miles out. That’s real, per atmospheric models from researchers tracking industrial sources. Your state’s hidden giant might be fouling air you breathe without a trace back to it.
Property Values Take a Direct Hit

Research from 2023 pegs housing price drops at 3 to 11 percent near heavy polluters, scaling with distance and toxin type. Homebuyers shy away from hazy zones, driving down demand and values. Real estate agents in affected areas whisper about “the plant effect” quietly.
The National Bureau of Economic Research backs this with data on depressed real estate from pollution exposure. Even subtle PM2.5 hikes correlate to measurable slumps in local markets. Sellers 20 miles out still struggle to fetch top dollar.
Health Toll Mounts Silently
The World Health Organization ties air pollution to nearly 7 million premature deaths yearly worldwide, with industrial sources front and center. Harvard T.H. Chan School of Public Health links long-term PM2.5 exposure to respiratory woes, heart disease, and shorter lives. Families downwind face higher risks without realizing the source.
It’s brutal how one factory’s output spikes asthma rates counties over. Recent studies from 2023-2025 hammer home the cardiovascular dangers. No wonder folks are fleeing, tanking those property rolls.
Environmental Justice Gap Widens

Reports from 2023 through 2025 spotlight low-income and minority neighborhoods hugging these high-emission sites. These communities bear the brunt, with dirtier air and steeper health bills. Property values lag hardest where people can least afford it.
It’s no accident; historical siting funnels polluters to vulnerable spots. EPA data shows disproportionate toxic loads there. The inequality fuels both health crises and real estate stagnation far beyond the fences.
Economic Ripples Spread Out

Beyond homes, pollution curbs local growth per National Bureau of Economic Research findings. Businesses hesitate in smoggy prospects, slowing jobs and investment. A super-polluter’s haze chokes the whole regional economy subtly.
Think tax bases shrinking as values dip across 50 miles. Developers pivot away, leaving ghost lots. It’s a slow bleed that hits schools and services hardest.
Recent EPA Crackdowns Heat Up
The agency rolled out tighter rules in recent years targeting power plants and chemical ops. 2024 actions stem from proof of broad regional fallout from single sources. Facilities now face stiffer monitoring for those wandering toxins.
Expect more scrutiny on TRI reporters dominating air releases. Early signs show some cuts in PM2.5 outputs. Still, legacy polluters keep pumping, dragging down distant properties.
Spotting the Culprit in Your Backyard
Dig into your state’s EPA TRI maps for the top emitters; tools like Toxics Tracker flag them quick. Chemical plants and mines often lead air and waste tallies. Cross-check with local air monitors for PM2.5 spikes.
Once you ID the beast, see sales data for value trends 10 to 50 miles out. Studies match the patterns every time. Knowledge arms you against the hidden drag on your nest egg.