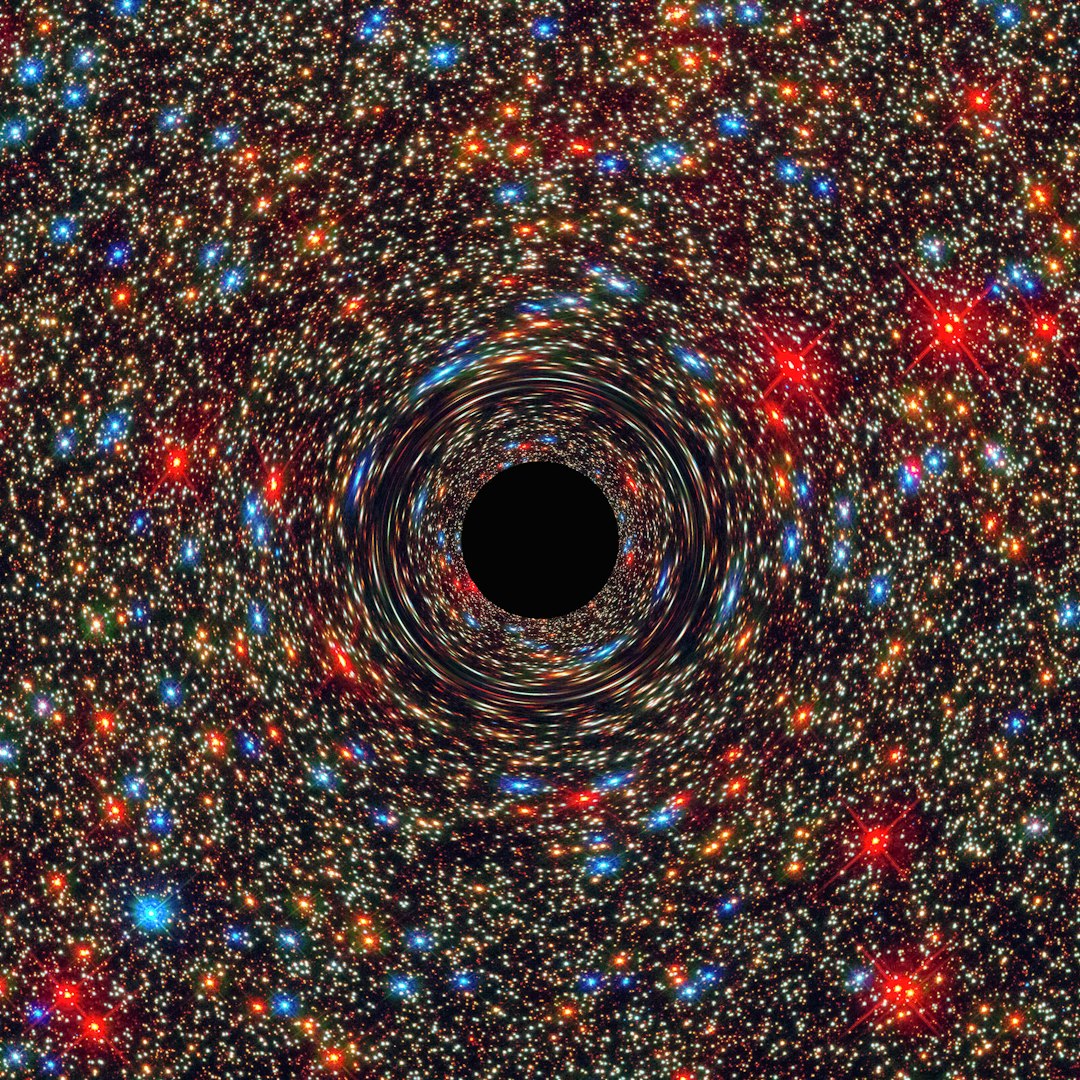


Blazars: The Universe’s Most Dynamic Performers (Image Credits: Unsplash)
Astronomers have long tracked the erratic brightness of blazars, the most energetic objects in the universe powered by supermassive black holes. Researchers recently transformed these light curves into audible music, revealing patterns that visual plots alone might miss. This innovative sonification technique, detailed in a new study, examines nine prominent blazars across multiple wavelengths and opens doors to more inclusive science communication.[1][2]
Blazars: The Universe’s Most Dynamic Performers
Blazars represent galaxies where supermassive black holes launch relativistic jets pointed directly at Earth. These jets produce intense emissions across the electromagnetic spectrum, from radio waves to gamma rays. Scientists monitor flux variations over time through light curves to understand particle acceleration and radiation mechanisms within the jets.
The study focused on nine blazars known for their variability: Mrk 501, Mrk 1501, Mrk 421, BL Lacertae, AO 0235+164, 3C 66A, OJ 049, OJ 287, and PKS J2134-0153. Data came from open databases covering radio, optical, X-ray, and gamma-ray observations by telescopes such as Swift-XRT, Fermi-LAT, and VERITAS.[1]
From Data Points to Musical Notes
The researchers preprocessed light curve data by removing outliers and binning flux values into seven levels. Each level corresponded to a note on a musical scale, with higher fluxes mapped to higher pitches and greater volumes. This parameter mapping ensured that brighter flares rang out louder and clearer.
Different wavelength bands occupied distinct octaves to distinguish radio hums from gamma-ray shrieks. A bell synthesizer generated the tones at a tempo of 80 notes per minute, mimicking a steady cosmic rhythm. The resulting audio files, accompanied by waveforms and spectrograms, allowed listeners to perceive temporal changes and cross-wavelength correlations.[1]
- Collect multiwavelength flux data from public archives.
- Clean and bin data into seven flux categories.
- Assign pitches, volumes, and octaves based on flux and band.
- Synthesize audio using a bell instrument.
- Generate visual aids like spectrograms for combined analysis.
Patterns Emerge in the Soundscape
Auditory analysis of BL Lacertae, a prototype blazar, highlighted quasi-periodic flares and power variations across bands. Spectrograms revealed prevalence of certain pitches, indicating dominant flux states, while waveforms captured amplitude shifts from dim periods to bright outbursts. Similar traits appeared in the other eight blazars, suggesting common variability drivers in their jets.
Listeners detected subtle regularities and data gaps more readily through sound than static graphs. For instance, synchronized peaks in optical and X-ray “melodies” pointed to linked emission processes. These insights complemented traditional visual methods, enriching the study of multifrequency behavior.[2]
Broader Impacts: Science and Accessibility
Sonification excels with complex, multidimensional datasets where visual overload obscures details. Human ears prove adept at discerning rhythms and harmonies, aiding pattern recognition in noisy astronomical data. The technique also promotes inclusivity, enabling visually impaired researchers and enthusiasts to engage directly with observations.
Beyond analysis, these cosmic compositions serve outreach efforts. Audio files for all nine blazars invite the public to “listen” to the universe’s drama. The approach sets a precedent for sonifying other datasets, potentially transforming how astronomy shares discoveries.[1]
Key Takeaways
- Sonification maps flux to pitch and volume, using octaves for wavelengths.
- Nine blazars’ light curves yield audible patterns like flares and correlations.
- Benefits include better pattern detection, data inclusivity, and engaging communication.
This sonification symphony demonstrates how blending senses unlocks deeper cosmic understanding. As tools evolve, auditory astronomy may become standard for probing the universe’s most enigmatic sources. What patterns do you hear in these stellar sounds? Share your thoughts in the comments.