
What Are Slow-Slip Events?
Slow-slip events represent a quiet release of tectonic stress along faults like Cascadia’s. Unlike regular earthquakes that shake the ground in seconds, these slip gradually over days or even weeks. They occur deep underground, typically 25 to 40 kilometers below the surface. Scientists first noticed them through subtle ground movements captured by GPS stations. In Cascadia, they pair with episodic tremor and slip, or ETS, happening roughly every 12 to 15 months. These events relieve some built-up pressure without causing felt shaking. Recent analyses using deep learning have identified dozens more of them than previously cataloged. Their slow nature makes them hard to spot without advanced tools.
During a slow-slip, the fault slides smoothly instead of jerking. This process releases energy equivalent to smaller quakes but spreads it out. In the Pacific Northwest, they migrate along the subduction zone over time. Researchers track them by watching for tiny deformations in the earth’s crust. These slips often cluster in specific zones downdip from locked areas. Data from 2023 and 2024 show varied patterns in their speed and reach. Understanding them helps gauge overall fault behavior. They remind us that faults stay active even when quiet on the surface.
The Scale of the Cascadia Subduction Zone
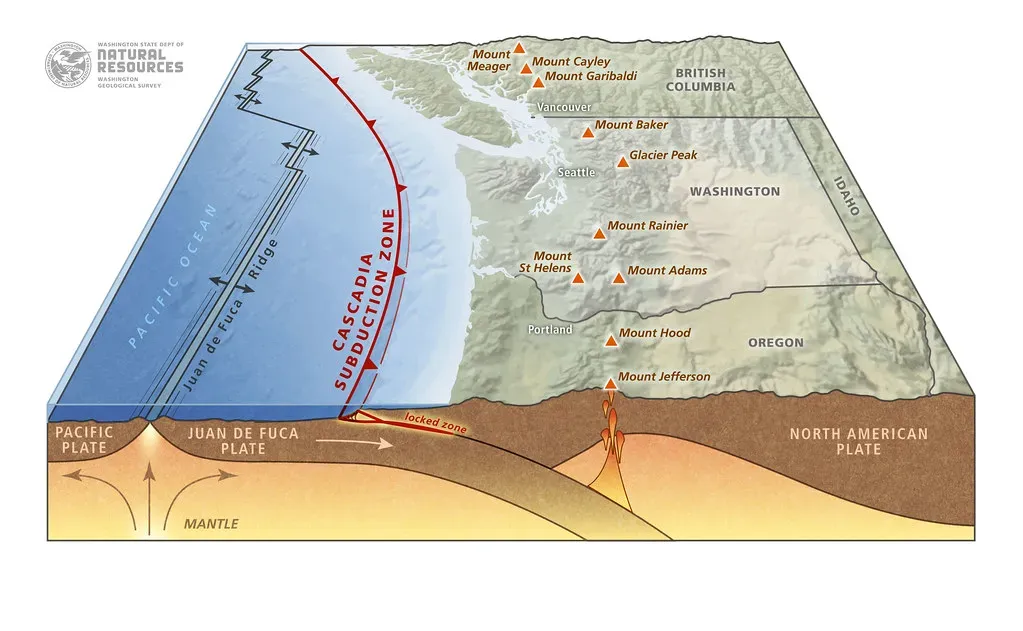
The Cascadia Subduction Zone runs about 1,000 kilometers from northern California to British Columbia. Here, the Juan de Fuca plate dives under the North American plate at a steady pace. This setup builds immense strain over centuries. Parts of the fault lock solid, holding stress until it snaps. Other sections creep or slip episodically. Seafloor data reveals near-full locking near the deformation front in central areas. Strain accumulates quietly offshore and onshore alike. The zone’s length means any big rupture could affect millions.
GPS measurements confirm ongoing deformation across the region. Locked segments offshore show steady plate convergence. Slow-slips happen in the transition zone deeper down. Recent seafloor geodesy from 2025 highlights this locking pattern. The entire system pulses with subtle activity year-round. Northern parts build strain persistently while central areas see more slip. This variability shapes quake potential. Monitoring the whole stretch demands widespread sensors.
Deep-Sea Sensors on the Front Lines
Deep-sea sensors from initiatives like the Ocean Observatories Initiative sit on the Pacific floor. They measure pressure changes, seafloor motion, and seismic tremors in real time. Cabled arrays provide constant power and data streams. These tools catch signals land stations miss due to ocean depth. Broadband seismometers detect faint tremor-like vibrations offshore. In 2025, one such sensor reported its first offshore tremor signals in Cascadia. This breakthrough reveals activity previously invisible. Pressure gauges spot tiny height shifts from slip events.
GNSS-acoustic systems track seafloor positions precisely. They confirm locking and creep patterns offshore. Combined with satellite data, they map strain buildup accurately. Recent deployments have boosted resolution dramatically. Sensors endure harsh conditions for years. Data flows back instantly for analysis. This network transforms our view of subduction dynamics. It flags slow-slips as they unfold.
Recent Readings from 2024 and 2025
Summer 2024 saw a clear ETS event along central Cascadia, with tremor bursting for weeks. Slow-slips accompanied it, migrating northward then stalling. Deep learning on GNSS data spotted 56 events from recent years, 18 more than before. Offshore sensors picked up tremor-like signals in late 2025 for the first time. These tied to deep slow-slips lasting hours to weeks. Patterns matched known ETS cycles every 14 months or so. Sub-daily imaging revealed fast slip front evolution. Readings showed heightened activity in northern zones.
2025 studies denoised signals to uncover a continuum of slips. Central Cascadia displayed protothrust activity alongside. Seafloor velocities indicated full locking near the front. Tremor spiked during these periods, confirming slip-tremor links. Data updated near real-time now tracks them daily. Winter 2022-2023 bursts set the stage for later ones. These detections paint a busier fault than thought. They underscore the need for ongoing vigilance.
How Slow-Slips Differ from Fast Quakes
Regular earthquakes unleash energy in moments, rattling everything nearby. Slow-slips drag on, releasing the same stress over much longer times. No strong shaking reaches the surface from them. Tremor, a low-frequency hum, often tags along instead. In Cascadia, ETS events average magnitude around 6.5 equivalent annually. They recur predictably unlike random quakes. Depths keep them stealthy without seafloor eyes. Duration varies from days to weeks per event.
Slip rates stay centimeters per day at most. Faults heal rapidly between slips, per lab tests. This cycling maintains stress balance partially. They cluster in the ETS zone, away from the locked megathrust. Offshore data now images their fronts accelerating. Interactions with fluids drive some starts. These traits set them apart fundamentally. They offer clues to bigger ruptures.
Stress Transfer to Locked Fault Parts
Slow-slips ease stress downdip but push it toward shallower locked zones. This transfer could nudge quake timing on the megathrust. Locked areas accumulate strain relentlessly. Recent seafloor data shows this handover clearly. ETS relieves about two to three centimeters of slip per cycle. Locked segments near shore hold far more. Protothrusts offshore feel pulses too. This dynamic raises questions about triggers.
Northern Cascadia locks fully, building tension steadily. Central parts slip more on secondary faults. Hydraulic fracturing deep down may spark some events. Strain maps from 2025 reveal hotspots. Slow-slips don’t cause quakes directly but load the system. GPS tracks the subtle shifts onshore. This interplay demands close watching. It hints at evolving risks over decades.
Lessons from the 1700 Megathrust
The last full Cascadia rupture hit in 1700, magnitude about 9.0. It spawned a tsunami that hit Japan days later. Oral histories and geology confirm the devastation. The fault has locked since, gathering strain. Over 325 years later, stress nears critical levels. Slow-slips now probe the same interface. They mimic aspects of that ancient slip. Modern tools weren’t there back then.
Tree rings and sediments mark the event precisely. Subsidence dropped coasts meters. Today’s sensors aim to catch precursors missed then. ETS patterns echo pre-rupture behaviors elsewhere. Cascadia’s quiet belies the buildup. Historical odds suggest recurrence every 300 to 500 years. Recent slips add nuance to forecasts. Preparedness draws from this long wait.
Earthquake Risks and What Lies Ahead
Experts peg a 10 to 15 percent chance of a major Cascadia quake in the next 50 years. Locked zones offshore amplify the threat. Slow-slips signal active stress management. Offshore sensors could give seconds more warning. Improved models from 2025 data refine probabilities. Tsunami risks loom largest for coasts. Public awareness grows with each detection. Retrofitting and drills ramp up accordingly.
Near real-time tracking now spots events early. Combining seafloor and land data sharpens pictures. Variability in slip could sway rupture paths. Northern locking poses unique challenges. Fluid roles in slips warrant more study. Long-term strain demands respect. These readings urge steady readiness. The fault whispers before it might roar.