

The Rise of the Latino Electorate
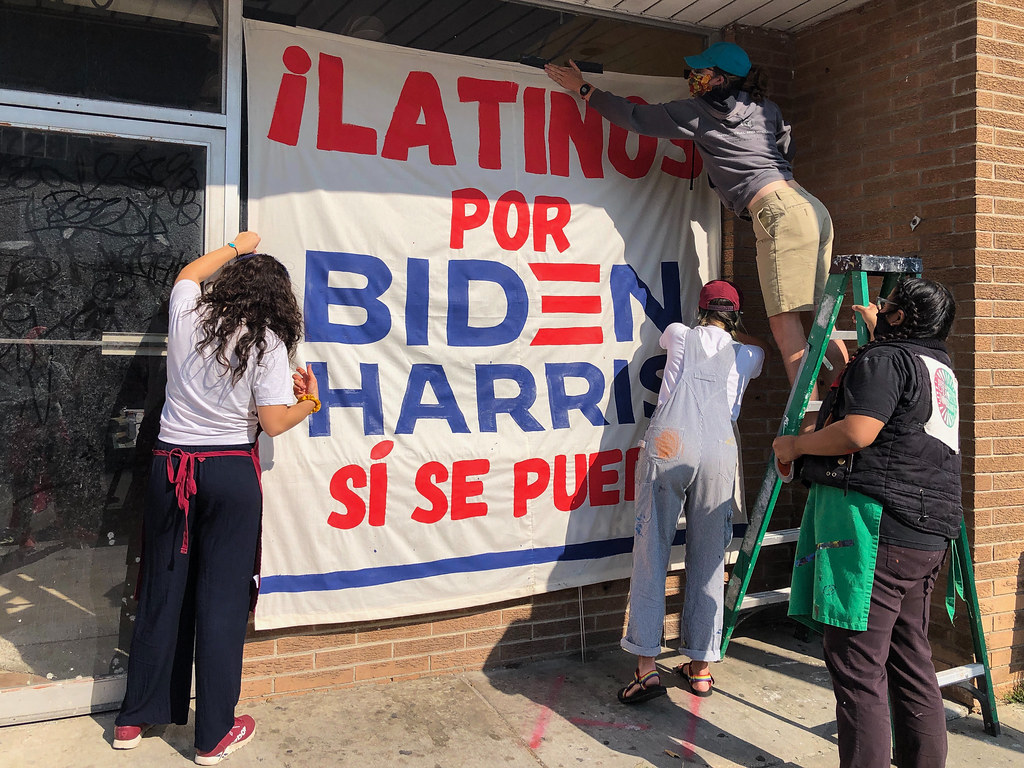
Latinos are the largest-growing group in the country and have increased as a share of the electorate in each of the last seven presidential elections, with substantial increases in all seven swing states. This demographic shift has profound implications for American politics, but what makes it particularly fascinating is the unexpected turn Latino voters took in 2024. Hispanic voters were divided in 2024, a major shift from 2020 and 2016 when Joe Biden won Hispanic voters by 25 percentage points, and Hispanic voters supported Hillary Clinton by an even wider margin in 2016. The Democratic Party’s traditional assumption that demographic growth would translate into electoral advantage has been challenged in ways few predicted. Trump drew nearly even with Kamala Harris among Hispanic voters, losing among them by only 3 points. They could be particularly influential in Arizona and Nevada, where they made up about 1 in 5 voters in 2020.
The Unstoppable Asian American Voting Force
Asian Americans are the fastest-growing demographic group and since 2008, they have voted overwhelmingly for Democrats. Here’s where the story gets interesting though. While a majority of Asian voters (57%) backed Harris in 2024, 40% supported Trump, which was a narrower margin than Biden’s in 2020 (70% to 30%). They could have the biggest impact in Nevada, where they are more than 9% of the eligible-voter population and were 5% of the electorate in the state in 2020, going for Biden by a 64%-35% margin. In Georgia, the AAPI population has grown by more than 50% since 2010, and while only about 3% of eligible voters, there were more than 45,000 first-time AAPI voters in 2020 who voted about 58% for Democrats, providing a margin of more than 7,000 votes in Democrats’ favor.
The Dramatic Shift in Black Voter Patterns
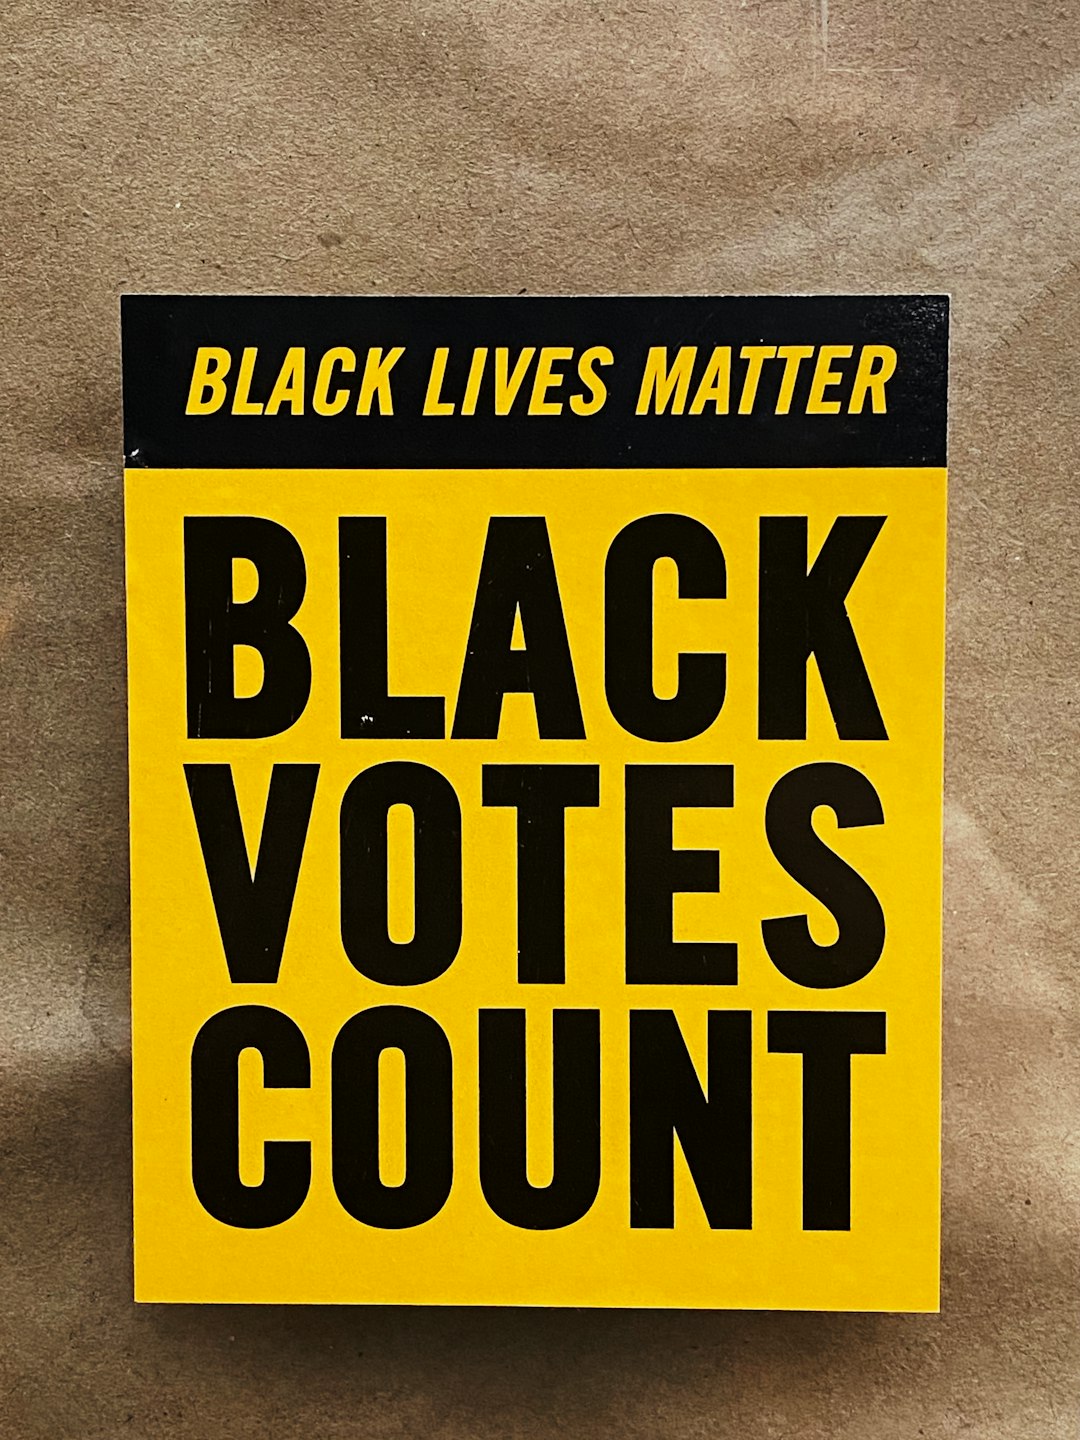
The most striking development in 2024 was the movement among Black voters, traditionally the most reliable Democratic constituency. Trump won 15% of Black voters – up from 8% four years earlier. Nationally, about 8 in 10 Black voters supported Harris, but that was down from about 9 in 10 in the last presidential election who went for Biden. The gender gap within Black voters tells an even more dramatic story. Trump about doubled his share of young Black men – about 3 in 10 Black men under the age of 45 went for Trump, roughly double the number he got in 2020. There was a small gender gap of 2 points between Black women and Black men in 2012, but in the Trump era, the gender gap substantially grew, driven by much larger support drops among Black men, expanding to 6 points in 2016 and an unprecedented 11 points in 2024.
The White Vote’s Surprising Resilience
Despite predictions of declining influence, white voters remain the largest single voting bloc and their patterns shifted in unexpected ways. The largest single voting group is white voters, with Republicans dominant with them in the last 20 years, but with the growing Latino and Asian American populations, white voters have been on a sharp decline as a share of the electorate since the 1990s. The October NPR/PBS News/Marist poll showed Harris winning 45% of white voters, which if it held, would be the highest share for a Democrat since 1976. White voters were a higher share of the electorate and voted in large numbers for Trump, with Trump’s margin with white voters essentially unchanged, but white voters making up larger shares of the electorate in key states helped fuel his victory.
Young Voters’ Unexpected Political Journey
Perhaps no demographic shift was more surprising than the movement among young voters in 2024. Americans under the age of 45 voted for Harris by a 2-point margin (49% Harris – 47% Trump), a 17-point swing from 2020 when Biden won these voters by 19 points. Men under the age of 45 voted for Trump by an 8-point margin, a 16-point shift from 2020, while women under 45 also shifted 5 points, voting for Harris by a 10-point margin. Americans under 30 voted for Harris by just 4 points, though young men and women diverged dramatically, with men under 30 voting for Trump by 16 points and women under 30 voting for Harris by 24 points. Members of both groups born in the 1980s and those born in the 1990s or 2000s became more likely to favor Trump between 2020 and 2024.
The Suburban Battleground’s New Reality
Suburban voters made up the largest shares of both Harris (56%) and Trump (49%) voters in 2024. The suburban vote has become the crucial swing vote in American politics, but its composition is changing rapidly. Trump benefited from changing turnout patterns among suburban voters, who continued to favor the Democratic candidate, but by a smaller margin than in 2020 (a 4-point margin in 2024 vs. 10 points in 2020). Urban voters were 21% of the national electorate in 2024, similar to 2020 while suburban voters comprised 56% of voters, up from 54% in 2016, with the rural electorate share dropping to 22% in 2024, down from 25% in 2020. Suburban demographic compositions vary regionally, with 84% of suburban voters in the Midwest battlegrounds being white compared to 71% in the Western battlegrounds and 62% in the Southeastern battlegrounds.
The Aging America Electoral Shift

America’s rapidly aging population is fundamentally changing the electoral landscape in ways that will have lasting political consequences. The U.S. population aged 65 and up grew by 13% between 2020 and 2024, while the number of those under 18 fell by 1.7%, with the U.S. median age hitting a new record high of 39.1 in 2024. The share of the U.S. population 65 and up increased from 12.4% in 2004 to 18% in 2024, while the share of children fell from 25% to 21.5%. There are now 11 states with more older adults than children, up from only three in 2020. Age has long been a reliable predictor of turnout, with citizens under age 30 constituting only 15% of all voters in 2024, considerably below their share of the age-eligible population (20%).
Immigration and the New American Voter
The foreign-born population has become a significant political force, with naturalized citizens playing an increasingly important role in elections. In 2024, naturalized citizens made up 9% of voters and split their votes about evenly, with 51% voting for Harris and 47% for Trump, compared to 2020 when naturalized citizens favored Biden by 21 percentage points. While migrant voters constitute a small share nationally, they have sizable clout in competitive battlegrounds, with 14% of voters in Nevada, seven percent in Georgia and five percent each in Pennsylvania and Michigan being foreign-born. The start of 2024 saw 7.4 million migrants likely eligible to naturalize, with 3.5 million having already done so, and their total size tops the margins of victory in virtually all key swing states, with Georgia’s 96,469 new citizens surpassing Biden’s roughly 12,000 margin of victory.
The College Education Divide’s Electoral Impact

Educational attainment has become one of the strongest predictors of voting behavior, creating new coalitions that cross traditional demographic lines. About six-in-ten voters in 2024 (59%) did not have a college degree, a share that has steadily decreased over time as more Americans obtain college degrees (in 2016, 63% of voters did not have a college degree). Almost half of nonvoters (48%) had only a high school education or less, compared with 28% among voters, while college graduates made up about twice the share of voters (41%) as nonvoters (22%). Voters with at least four-year college degrees and urban residents voted for Harris by wide margins, while Trump retained sizable advantages among noncollege voters and voters living in rural areas. Those who voted for Democratic candidates in recent elections have been more likely than Republican voters to have a college degree.
The Turnout Revolution’s Demographic Consequences
The 2024 election revealed a fundamental shift in who actually shows up to vote, with turnout patterns favoring Republicans in unprecedented ways. In the overall electorate and among key demographic groups, Republican-leaning eligible voters simply were more likely to turn out than Democratic-leaning eligible voters in 2024. The 2024 Trump campaign was reported to be targeting infrequent voters, with voters in 2024 who had not turned out in 2020 favoring Trump by a margin of 54%-42%. In the 2024 presidential election, a higher share of Donald Trump’s 2020 voters than Joe Biden’s 2020 voters turned out to vote, and Trump also won a higher share of those who had not voted four years earlier. The 64% turnout rate in 2024 was the second highest since 1960, behind only 2020.
Geographic Mobility and Electoral Consequences

American population movements are reshaping the electoral map in ways that challenge traditional assumptions about red and blue states. In line with global trends, America’s cities and suburbs are gaining population much faster than rural areas, with urban and suburban voters growing as a share of the electorate while rural voters declined. The electorate in 2024 battleground states was more urban and suburban this cycle than in past years, with 14% urban (up from 13% in 2020) and 61% suburban (up from 58% in 2020), while rural voters comprised 25% in 2024, down from 29% in 2020. Those in urban counties mostly align with the Democratic Party, while the reverse is true among those in rural counties, with suburbs where a majority of Americans live having fairly evenly divided voter partisanship.
The Nonvoter Mystery and Its Political Implications

One of the most significant changes in 2024 was the shifting preferences of Americans who don’t vote regularly, a group that has traditionally leaned Democratic. In both 2016 and 2020, nonvoters preferred the Democratic candidate and leaned Democratic in party affiliation, but in 2024, nonvoters were more closely divided: 44% preferred Trump and 40% preferred Harris, with 48% identifying as Democratic and 45% as Republican. Most Americans are not regular voters, with just 41% of adult citizens who were old enough to vote casting a ballot in all three most recent national elections, despite higher-than-normal turnout. Almost half of non-Hispanic White adult citizens (48%) voted in all three elections, compared with 27% of Black adults and 25% of Hispanic adults, with Hispanics about twice as likely as White adults to have not voted at all in these three elections.
The Rural-Urban Divide’s Deepening Political Chasm
The political differences between rural and urban America have reached historic levels, creating distinct voting patterns that transcend traditional demographic categories. Over the past two decades, voters in rural counties have become increasingly Republican, growing from a narrow 51% vs. 45% Republican advantage in 2000 to a 13 percentage point advantage by 2010. White voters in rural counties are especially likely to identify as Republican (66% do so), compared with 57% of White voters in suburbs and 48% in urban counties. Young rural/small town voters preferred Trump by a 22-point margin (60% to 38%), while young suburban voters (56% to 43%) and young urban voters (61% to 37%) preferred Harris. The small town/rural youth support for Trump was driven largely by white youth, with young white voters from those communities backing Trump by more than two-to-one (68% vs. 31% for Harris).
The Gender Gap’s Evolving Political Dynamics
The gender gap in American politics has reached new dimensions, but it’s not simply about men versus women anymore. The shifts by gender were concentrated among younger voters, as well as Black and Latino voters, while white voters across genders and older voters across genders voted similarly in 2024 as they did in 2020. Trump benefited from narrow gains among both men and women, with Harris having the advantage among women (53% to 46%), but that margin was somewhat narrower than Biden’s. Men – especially men under 50 – backed Trump by larger margins, with Trump narrowly winning men under age 50, a shift from 2020 when men in that age group favored Biden by 10 points. The largest shifts in support were seen among men, particularly men of color.
The 2024 election fundamentally challenged the conventional wisdom about American demographics and voting patterns. What once seemed like predictable trends based on race, age, and geography proved far more complex and fluid than political strategists had anticipated. The diversification of Trump’s coalition, the weakening of traditional Democratic strongholds among young voters and communities of color, and the shifting preferences of nonvoters all point to an American electorate that defies simple categorization. These changes suggest that future elections will be determined less by demographic destiny and more by the ability of candidates and parties to appeal across traditional boundaries, making American politics more unpredictable and competitive than many had imagined.