

Something quiet but powerful is happening to the American electricity grid, and it’s showing up differently depending on where you live. Your neighbor two states over might be paying half of what you pay for power, and by the time 2026 is done reshaping how utilities charge households, that gap could get even wider. This isn’t just about rising bills. It’s about a deep, structural transformation in how energy is generated, priced, and distributed, driven by everything from artificial intelligence to wildfires.
The truth is, your zip code has always mattered when it comes to energy costs. What’s changed is just how dramatically it now matters, and how many forces are all converging at once. Let’s dive in.
America’s Electricity Price Map Is More Divided Than Ever

If you live in Louisiana, you might be paying just above 12 cents per kilowatt-hour. Move to Massachusetts, and you’re looking at more than 31 cents. That is not a small difference. That is practically a different economic reality.
Electricity costs follow clear geographic patterns driven by fuel sources, infrastructure age, and regulatory structure. The Northeast pays about 42% more than the national average, while the South Central region enjoys rates roughly 22% below it. Those are numbers that can add up to hundreds of dollars every single year.
Electric bills vary by over 130% across states, from Utah’s $94 per month to Connecticut’s $220 per month, making location one of the most significant factors in household energy costs. Honestly, that’s a staggering spread. Imagine two families of the same size, living similar lives, but one paying more than double in electricity just because of their address.
North Dakota currently pays the cheapest residential electricity rates in the country at around 10.92 cents per kWh, while Hawaii’s rates are the highest, at 39.79 cents per kWh. This kind of geographic lottery is only expected to intensify as new grid policies take hold.
Prices Have Been Climbing Fast and 2026 Is Not Letting Up
Here’s the thing: this isn’t some sudden shock. The trajectory has been building for years. Residential electricity prices across the U.S. are rising by about 4.2% in 2026, continuing a troubling trend. Since 2020, rates have climbed roughly 36%, making electricity one of the fastest-growing household expenses.
The average U.S. electric utility rate increased nearly a full 10% in just the first five months of 2025 alone, amounting to nearly $14 more per month for using the same amount of electricity. Although it is typical for utility rates to rise in summer and fall in winter, that increase was substantially higher than in previous years.
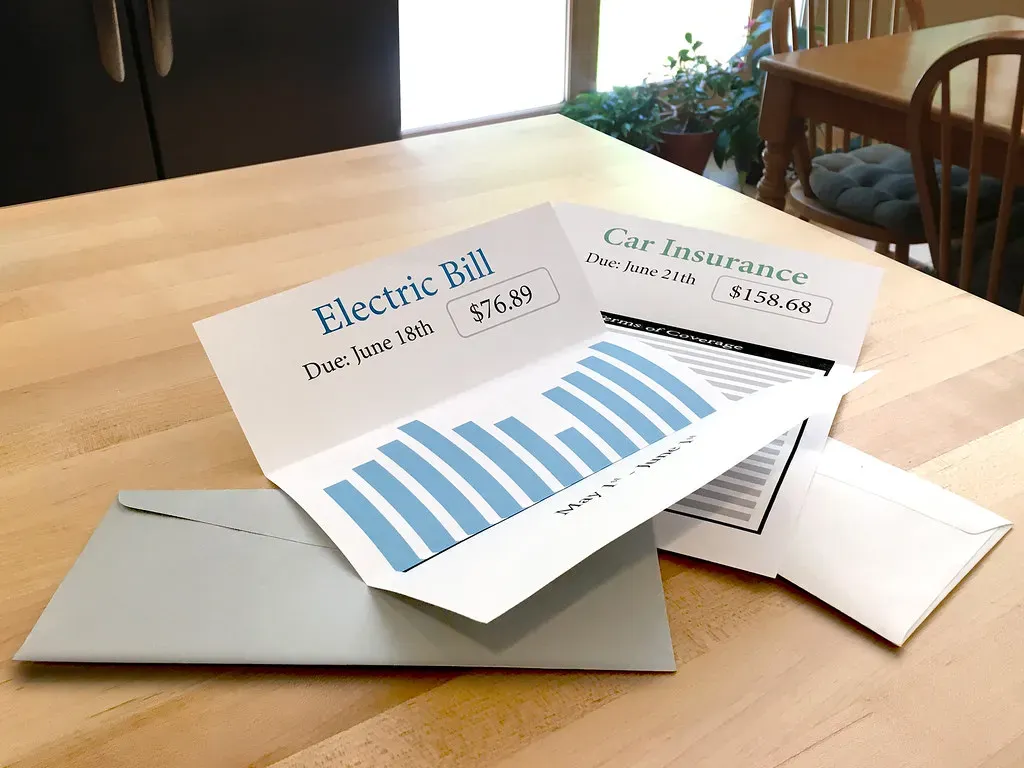
A report released in March by the congressional Joint Economic Committee found the average U.S. household paid about $110 more for electricity in 2025 compared to 2024, a 6.4% increase. That’s not just an inconvenience. For millions of households, it means making hard choices.
As of late 2025, utility arrearages, meaning unpaid bills, are rising. Past-due balances jumped nearly 10% between 2024 and 2025, reaching an average of $789, coinciding with a 12% jump in monthly energy bills over the same period. The stress is real, and it’s spreading.
Why Where You Live Now Determines What You Pay

Think of electricity pricing like real estate. Location is everything. States with abundant local energy resources like coal, natural gas, or hydropower typically enjoy lower generation costs. States with more stringent environmental regulations and renewable portfolio standards often have higher rates as utilities invest to meet these requirements.
In many areas, it’s not just that bills are rising. Sharp swings in bills are especially difficult for households to manage. The median difference between the highest and lowest bills in 2025 was $92, representing a 91% swing within the same year. That kind of volatility makes household budgeting feel like a guessing game.
In parts of the Mid-Atlantic, persistent bottlenecks in adding new capacity to the grid, as well as surging power demand driven primarily by data centers, are causing generation costs to get bid up. In New Jersey, for example, one utility’s generation-related charges increased by more than 50% year on year.
The AI and Data Center Surge Is Hitting Local Grids Hard
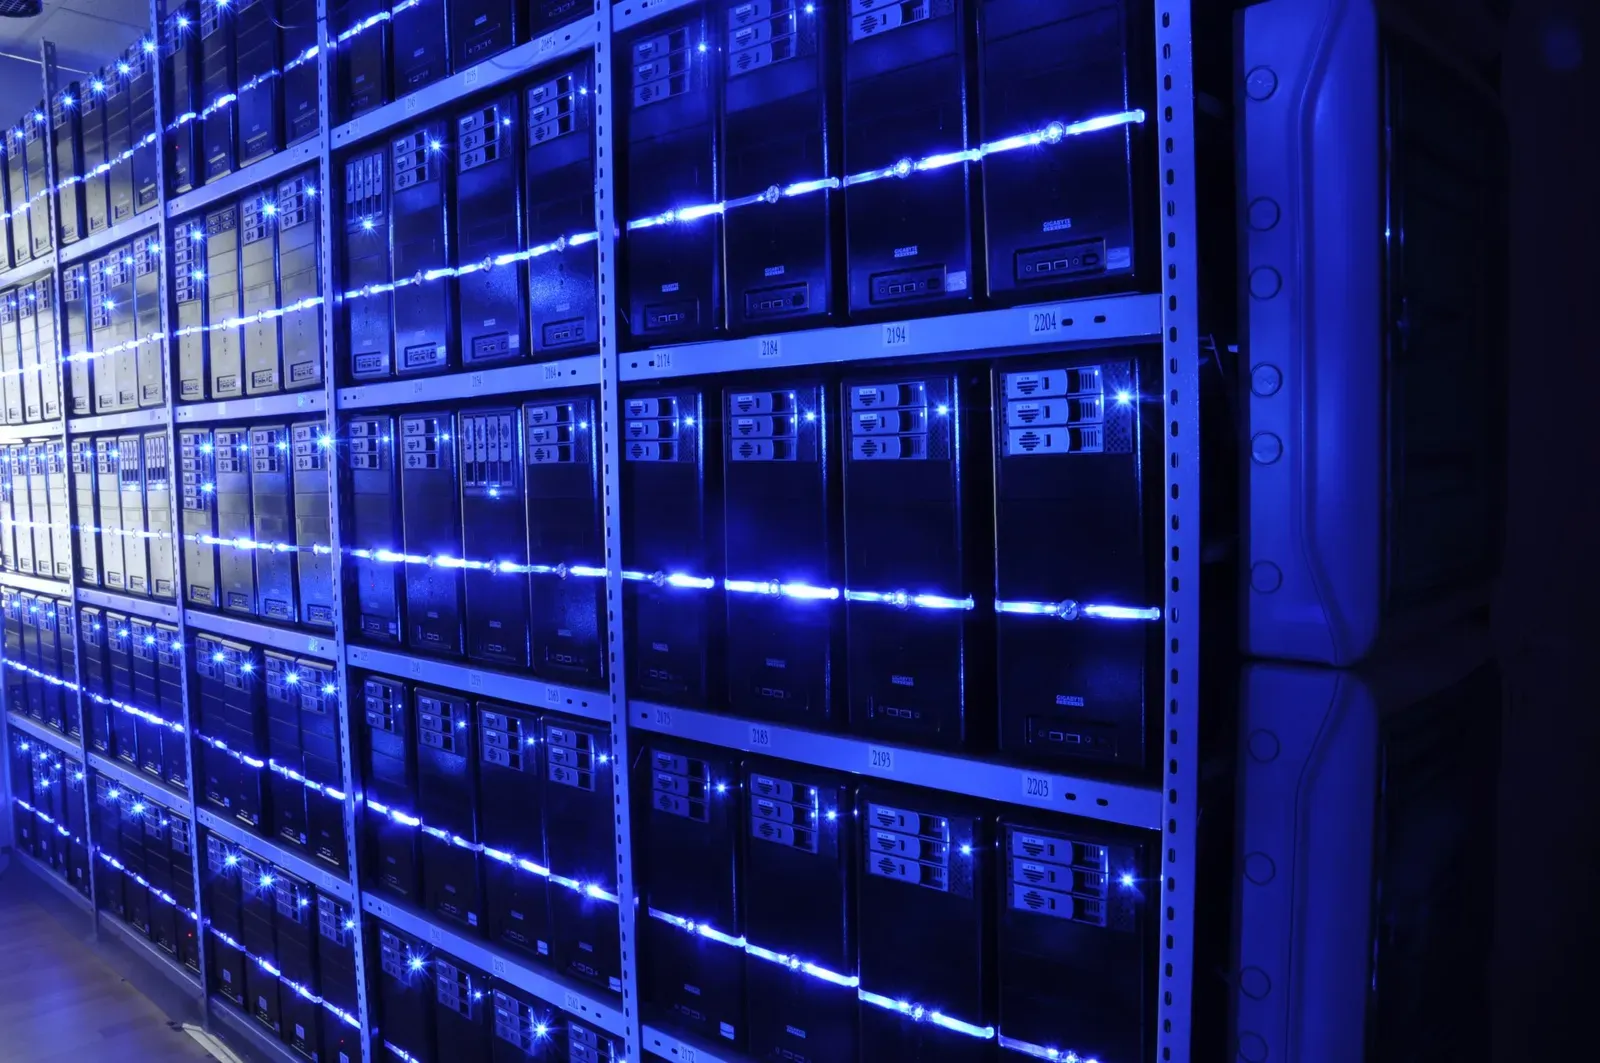
I know it sounds a bit abstract, but every time a large language model runs a query, somewhere a power plant burns fuel. Multiply that by millions of queries per day, and you start to see why data centers are quietly reshaping electricity demand in ways nobody fully anticipated.
Artificial intelligence is reshaping electricity demand. AI training and inference facilities require massive amounts of continuous power. Projections show data center energy demand will rise from about 5% of total U.S. electricity use in 2025 to nearly 12% by 2030.
This growth isn’t evenly distributed. It’s concentrated in hubs like Northern Virginia, Ohio, and Texas, creating severe local grid congestion. People living near these data center corridors are already seeing the consequences in their bills, whether they know it or not.
The impact is clearest in capacity markets, where power plants are paid to ensure they’re available during peak demand. The PJM Interconnection, serving 13 states, experienced a striking price increase in its 2025/2026 auction, with capacity prices jumping from roughly $30 per megawatt-day to $270 per megawatt-day. That tenfold jump is extraordinary, and it will flow through to consumer bills.
Extreme Weather Is Becoming an Invisible Fee on Your Bill

Every wildfire in California, every Gulf Coast hurricane, every Texas ice storm leaves a financial scar on the grid. Those costs don’t just evaporate. They get passed on to you, one line item at a time.
Record data center construction in 2025 pushed commercial and industrial consumption higher. At the same time, grid hardening investments in response to extreme weather, including wildfires in the West, hurricanes along the Gulf Coast, and winter storms in Texas, added infrastructure costs that utilities passed through directly to ratepayers.
In many parts of the country, extreme weather is driving higher distribution costs. While wildfire-related costs in California offer the most extreme example, storm costs are showing up in rising bills across the country. In Florida, for example, Tampa Electric customers have seen storm-related charges rise steadily, increasing from a credit in 2020 to more than 2.7 cents per kilowatt-hour in 2025.
It’s worth thinking about this way: when a hurricane destroys transmission lines in Louisiana, consumers across the region essentially end up paying for the repair over years. Your electricity bill is, in a sense, also an insurance policy on aging infrastructure.
California and New York Are Rewriting the Rules on Who Pays What

Perhaps the most politically charged development in the 2026 energy shift is the push to tie fixed electricity charges to household income. California went ahead and did it, and the ripple effects are only just beginning.
The California Public Utilities Commission unanimously approved a new income-graduated fixed charge for the state’s investor-owned electric utilities. The move significantly changes the structure of customer bills, aiming to encourage electrification and take strain off low-income customers struggling with high energy prices. The new billing structure was mandated by Assembly Bill 205, passed by California lawmakers in 2022.
The fixed charge began showing up on San Diego Gas & Electric and Southern California Edison bills in late 2025, and for Pacific Gas & Electric customers in early 2026. Regulators expect the change to reduce residential electricity rates by 5 to 7 cents per kilowatt-hour. Lower-income households pay reduced fixed fees of $6 or $12 per month, while most others pay $24.15.
Californians are facing a utility bill affordability crisis. In just a few years, residential rates have spiked dramatically for customers of the state’s largest investor-owned utilities. One in five households served by those utilities is now behind on their bills. The income-based approach is bold, but the debate about whether it truly helps is nowhere close to settled.
Time-of-Use Pricing Is Changing When You Do Your Laundry

This one sounds simple but it has surprisingly big implications. Across the U.S., utilities are increasingly charging different rates depending on the time of day, essentially making electricity cheaper at 2 a.m. and more expensive at 6 p.m. Think of it like surge pricing on a ride-share app, except for your dishwasher.
According to data from the Lawrence Berkeley National Laboratory, over 30% of U.S. households now have access to time-of-use rate plans, and that number continues to grow. Utilities argue these plans reduce strain on the grid during peak hours and lower overall system costs. For households willing to shift habits, it can mean real savings.
Electricity rates are usually lowest during off-peak hours overnight and in spring and fall months when electricity demand is lower. Time-of-use plans can take advantage of this drop in overall energy usage. Electric vehicle owners in particular stand to save meaningfully by charging overnight instead of during peak evening hours.
The Inflation Reduction Act Is Reshaping State-by-State Energy Economics
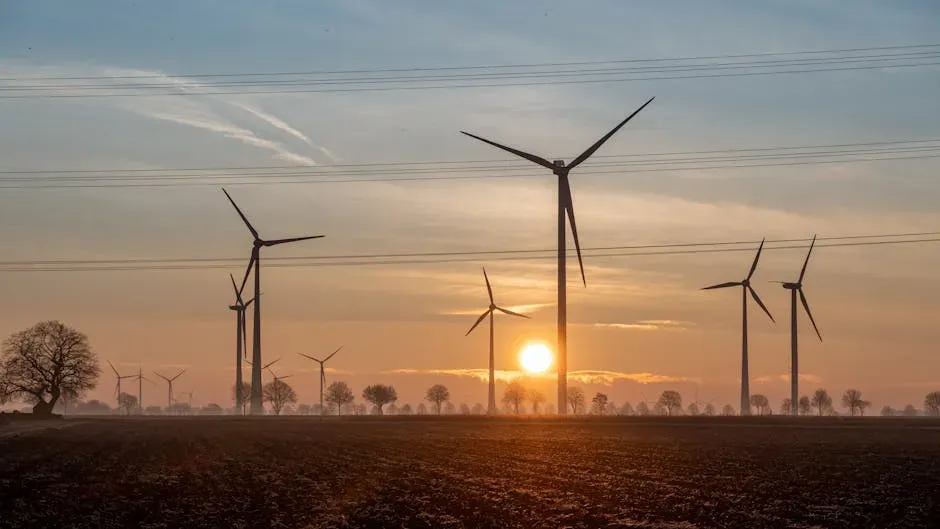
Federal policy is rarely felt directly in day-to-day life, but the Inflation Reduction Act of 2022 is a genuine exception. It has funneled hundreds of billions of dollars into clean energy, and where that money flows is changing the competitive landscape of electricity pricing across the country.
The Inflation Reduction Act of 2022 is the most significant climate legislation in U.S. history, offering funding, programs, and incentives to accelerate the transition to a clean energy economy and will likely drive significant deployment of new clean electricity resources. The effects are becoming visible in local grid infrastructure and energy costs from 2025 onward.
By January 2025, the IRA had contributed to at least 406,000 new jobs across 751 projects and $422 billion in investments. The Biden administration claimed the combined effect of major legislation catalyzed $1 trillion in private investment, including over $200 billion in clean power. That level of investment is already reshaping which states generate their own clean electricity and which still rely on expensive imports.
On a per-person basis, people living in Republican-leaning states were slated to receive nearly double the monetary investment per person compared to those in Democratic-leaning states. Interestingly, much of the economic benefit from clean energy transitions is landing in places where people might least expect it politically, which is worth watching as new policy debates unfold.
Conclusion: Your Zip Code Is Now an Energy Policy Statement
It’s hard to say for sure exactly how each local market will shake out over the next few years, but the direction of travel is clear. Electricity in the United States is becoming more expensive on average, more variable by location, and more shaped by forces that have nothing to do with how much power you personally use.
More than half of Americans say that power bills are causing at least a decent amount of stress on their budgets. That number is telling. Electricity is no longer a background expense that people barely notice. It has become a real, front-of-mind financial burden for a majority of households.
The 2026 energy shift is not one single event. It is a collision of climate costs, technology demand, policy change, and aging infrastructure, all arriving at the same moment. Where you live determines which of those forces hits you hardest, and how little control you have over the outcome. The best thing anyone can do right now is understand the game before it changes the board underneath them.
Did you expect your zip code to have this much power over your wallet? Tell us what you think in the comments below.


