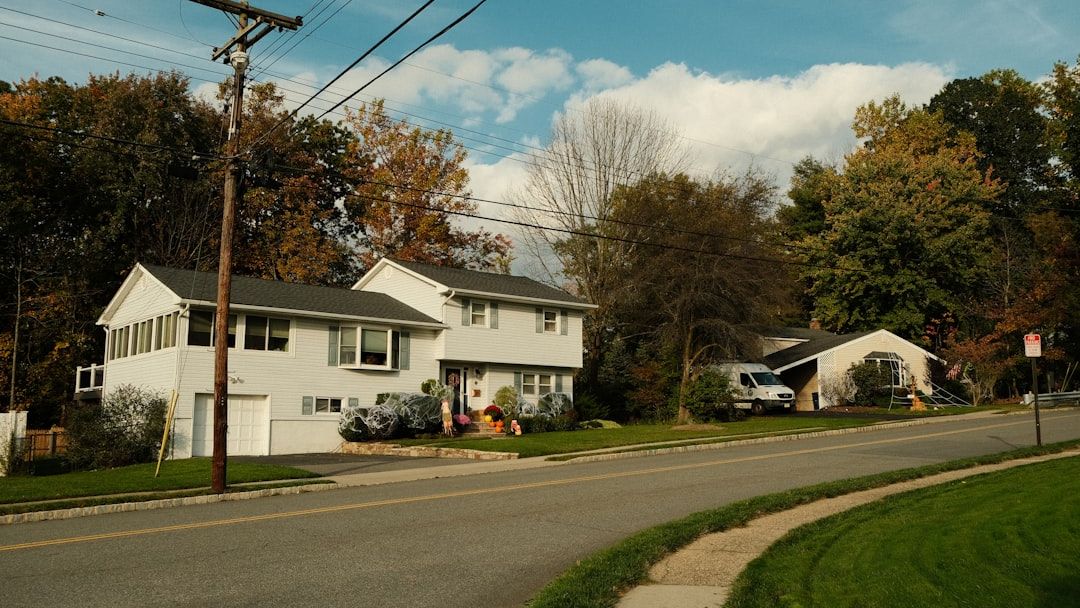

Picture this: the classic American Dream of owning a home feels further out of reach for many these days. Yet headlines scream about a collapse in ownership rates. What’s really happening in 2026?
Numbers tell a more complicated story than outright doom. Let’s unpack the data step by step, from raw stats to the forces at play. You might be surprised by the nuances.
Overall Rate Holds Steady at 65.7%
The US homeownership rate sat at 65.7 percent in the fourth quarter of 2025, barely budging from the same period a year earlier.[1] This figure comes straight from the Census Bureau’s Housing Vacancies and Homeownership survey. It’s not crashing, but hovering well below the long-term average.
Quarterly dips happened, like 65.0 percent in Q2 2025, the lowest since 2019.[2] Still, it inched back up by year-end. Honestly, stability feels like a win amid all the noise.
Far Below Historic Peaks
Back in 2004, ownership peaked at 69.2 percent, a level we haven’t touched since.[3] Today’s 65.7 percent lags about 3.5 points behind that high water mark. The 25-year average sits around 66.3 percent too.
This gap persists despite population growth and economic shifts. Here’s the thing: slow household formation plays a role, especially among renters who can’t break in. It paints a picture of stagnation more than freefall.
Young Adults Hit Hardest

Under-35 householders saw their rate climb to 37.9 percent in Q4 2025, up 1.6 points from a year prior.[3] Even so, that’s dismal compared to older groups. Gen Z adults hover around 27.1 percent ownership.[4]
Millennials fare better at roughly 55 percent, but gains stalled.[5] Affordability walls them out. I know it sounds tough, but entry-level homes just aren’t there for starters.
Skyrocketing Home Prices Lock Many Out

House prices rose 1.8 percent year-over-year through Q4 2025.[6] That’s on top of massive gains since 2020, up over 50 percent in many spots. Buyers need bigger down payments now.
Nationwide, median prices strain budgets, especially for first-timers. Nearly 20 percent of new homes saw price cuts in late 2025, hinting at desperation.[7] Yet demand pushes values higher overall.
Mortgage Rates Remain a Barrier
Rates dipped to about 6.2 percent in 2025, but stayed elevated for years.[5] Monthly payments ballooned, pricing out millions. Younger borrowers feel this pinch most.
Lock-in effect keeps existing owners put, with low-rate mortgages from pandemic era. New buyers face double the cost in some cases. It’s like running a race with weights on your ankles.
Inventory Shortage Fuels the Fire
Housing supply lags far behind demand, with deficits estimated from 2 to 20 million units.[8] Listings ticked up 7 percent by early 2026, but not enough.[9] Builders can’t keep pace.
This crunch drives competition and higher bids. Entry-level inventory, key for young families, vanished. No wonder nearly 2 million millennial and Gen Z households never formed in 2025.[10]
Affordability Crisis Hits New Highs
Over 21 million homeowners spend more than 30 percent of income on housing costs.[11] Renters fare worse, fueling delayed purchases. Costs beyond mortgages, like insurance, jumped 35 percent since 2019.
This squeezes everyone, but hits potential buyers hardest. Suspended adulthood for young adults? That’s the reality Realtor.com calls out.[12] Brutal, right?
Generational and Racial Divides Grow
White Gen Z owns at 31.6 percent, Black at just 14.2 percent.[13] Older boomers hold steady or better. Wealth gaps compound the issue.
Middle-aged groups like 35-44 saw slight drops to 60.9 percent.[3] Everyone feels the strain differently. It’s reshaping the housing ladder unevenly.
Mortgage-Free Ownership on the Rise
Nearly 40 percent of homes now mortgage-free, up from 34.4 percent a decade ago.[14] Seniors paying off loans bolster this trend. Share of mortgaged homes fell to 59.7 percent in 2024.[15]
This offsets some declines elsewhere. Owners without debt still face taxes and upkeep hikes. A silver lining in tough times.
2026 Forecast Points Downward

Realtor.com predicts a dip to 64.8 percent next year.[16] Slower household growth for owners ahead, per Harvard researchers.[17] Affordability headwinds persist.
Inventory may rise 10-15 percent, easing pressure slightly.[18] Prices could stall. Fingers crossed for relief.