
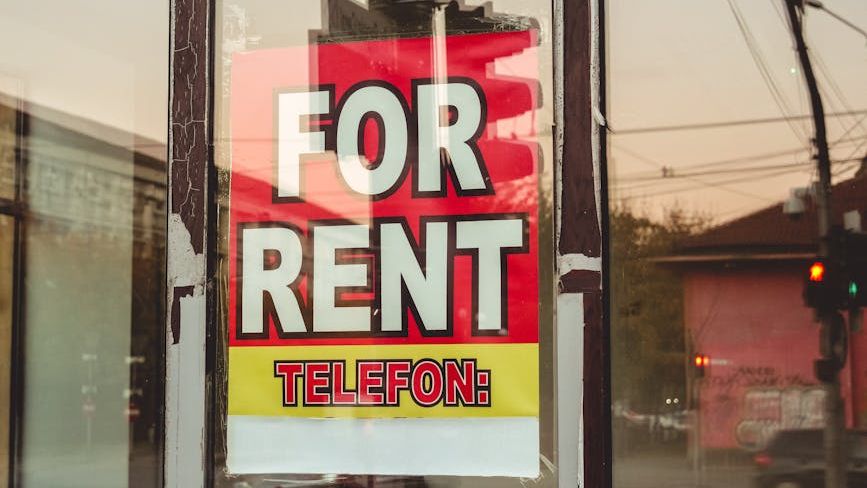
Historic Slowdown Reshapes Rental Landscape (Image Credits: Pexels)
United States – The nation’s rental market has cooled dramatically after years of relentless price surges tied to the pandemic. Leading data trackers reported year-over-year declines in median rents during early 2026, marking the slowest growth rates since the early days of the crisis.[1][2] High vacancy rates and a flood of new apartment completions shifted leverage toward tenants, easing the burden on households nationwide. This downturn provided tangible relief, though affordability struggles persisted for many low-income renters.
Historic Slowdown Reshapes Rental Landscape
Apartment List tracked the national median rent at $1,363 in March 2026, reflecting a 1.7 percent drop from the year before – the weakest annual change since records began in 2017.[1] That figure trailed the mid-2022 peak by 5.5 percent, or $79 monthly. Realtor.com noted similar trends, with the median asking rent for all units falling to $1,667 in February, down 1.7 percent year over year and 5.1 percent below its 2022 high after 30 straight months of declines.[2]
Zillow observed a slightly higher typical asking rent of $1,895 in January, up just 2 percent annually – the slowest pace since December 2020.[3] Single-family rents grew faster at 2.7 percent, while multifamily units advanced only 1.4 percent. These metrics highlighted a market settling after pandemic-era spikes that pushed rents up more than 25 percent in some segments.
| Source | Period | Median/Typical Rent | YoY Change |
|---|---|---|---|
| Apartment List report | March 2026 | $1,363 | -1.7% |
| Realtor.com report | February 2026 | $1,667 (all) | -1.7% |
| Zillow report | January 2026 | $1,895 | +2.0% |
Supply Boom and Demand Dip Fuel the Reversal
A massive wave of multifamily construction played a central role in the slowdown. Completions reached 488,000 units in 2025, down 20 percent from 2024 but still far above pre-pandemic norms, according to Harvard’s Joint Center for Housing Studies.[4] Vacancy rates for professionally managed apartments climbed to 7.3 percent nationally in early 2026, a record high since Apartment List began tracking in 2017.[1]
Demand weakened amid economic uncertainty, including labor market softening and renewed inflation pressures. Apartment List analysts noted, “We’re past the peak of a multifamily construction surge, but a healthy supply of new units are still hitting the market and colliding with sluggish demand, causing vacancies to remain elevated.”[1] List-to-lease times stretched to 38 days, the longest for a March since 2019. Meanwhile, units under construction fell to 686,000 by late 2025 from a 2023 peak of 996,000.
Sharp Regional Splits Define the Trends
Sun Belt markets bore the brunt of the downturn, with oversupply hitting cities like Austin and Phoenix hardest. Apartment List identified Austin’s rents down 6 percent year over year, the softest among large metros and more than 20 percent below its 2022 peak.[1] Realtor.com ranked Austin 18.2 percent below its peak after 34 months of declines, followed by Birmingham, Memphis, Phoenix, and Atlanta – all down more than 15 percent cumulatively.[2]
Northeast and Midwest areas showed resilience. Virginia Beach led with 5.5 percent growth, alongside San Francisco and San Jose buoyed by tech jobs.[1] Harvard data confirmed rents fell in 74 of the 150 largest markets but rose modestly in 70 others, with steeper drops in the South and West.[4]
- Highest YoY growth: Virginia Beach (+5.5%), San Francisco, San Jose, Chicago, St. Louis.
- Lowest YoY growth: Austin (-6%), San Antonio, Denver, Phoenix, Tampa.
- Markets near peaks: Virginia Beach, Kansas City, Baltimore, San Jose, Richmond (all within 3 percent, tightening vacancies).
- Deepest cumulative drops: Austin (-18.2%), Birmingham (-17.1%), Memphis (-16.1%).
Affordability Gains Tempered by Persistent Pressures
Renters gained breathing room as prices stabilized. Zillow calculated typical households devoted 26.4 percent of income to rent in January 2026, the lowest share since August 2021.[3] Nearly 40 percent of listings offered concessions like a free month’s rent. Yet Harvard reported 22.7 million renter households – nearly half of all renters – remained cost-burdened, spending over 30 percent of income on housing in 2024.
Severely burdened cases affected 12.1 million households, with rates exceeding 50 percent in states like Florida and Nevada. Low-rent stock eroded, losing 9.3 million units under $1,400 from 2014 to 2024. Burdens rose across demographics, hitting 83 percent of households earning under $30,000.
Key Takeaways
- Rent growth reached record lows, down 1.7 percent nationally in early 2026.
- Vacancies hit 7.3 percent amid 488,000 new units completed in 2025.
- Sun Belt cities saw the sharpest drops, while Northeast markets grew modestly.
The rental slowdown offered a long-overdue respite for tenants after pandemic highs, but underlying affordability woes demanded sustained policy attention. With supply growth easing and demand uncertain, modest stability appeared likely through 2026. What impact have these trends had on your housing search? Share your thoughts in the comments.